ISC-12>PRACTICAL>PLANT PHYSIOLOGY EXPERIMENTS
STUDY OF BIOCHEMICAL AND PHYSIOLOGICAL EXPERIMENTS IN PLANTS
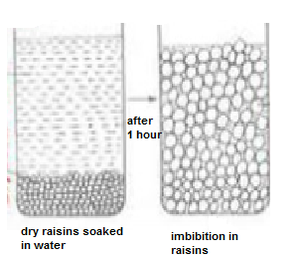
I. DEMONSTRATION OF IMBIBITION
AIM: To demonstrate the process of imbibition by using raisins.
|
Material Required : Raisins, Petri dishes ,Beakers, Water, Weighing machine
Procedure :
The raisins without water have wrinkled surface and less turgid while the raisins which were kept in water appear to have smooth surfaced and turgid. Result : Total mass of raisins before putting in to beaker : ________________ gm Total mass of raisins at the end of 30 mins : ________________ gm Difference in mass : _____________ gm |
|
II. STUDY OF OSMOSIS IN PLANTS
A. Aim: To demonstrate osmosis in living plant cells by potato osmoscope.
Material Required: Potato tuber, knife or scalpel, 20% sugar solution, red colour, distilled water, petri-dish, alpin, peeler
Procedure:
Procedure:
- Peel off the skin of a potato of medium or large size. Make a cavity in it with the help of knife.
- Clean a large petri-dish and fill it with water. Add 2 or 3 drops of red colour so that water of the dish becomes coloured.
- Fill the cavity of the tuber with 20% sugar solution and keep it in the dish, containing coloured water.
- Insert an alpin on the wall of the potato cavity to mark the original level of sugar solution in it.
- Leave the setup for about one hour.
- After an hour it is observed that the level of sugar solution inside the cavity of potato osmoscope rise and becomes stable after certain period.
- The potato cavity is surrounded by living cells.
- The plasma membrane of each cell inside cell wall acts as a semi permeable membrane.
- When potato osmoscope is placed in the dish filled with water, water diffuses into it through cell wall of potato tuber cells. This is the phenomenon of endosmosis, i. e, water from the petri-dish diffuses from its higher concentration to lower concentration.
- Hence, the initial level of sugar solution increases. This process of endosmosis continues until the hydrostatic pressure is created.
- Wall of the potato at the base should be thin.
- Potato should be kept vertically.
- Use the fresh and recently peeled potato.

Drawing courtsey- Pooja Jasani (ISC 2014)
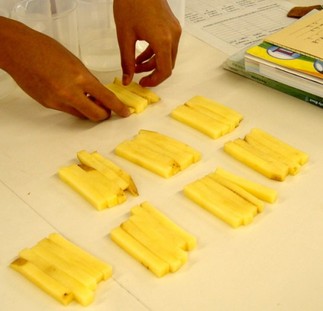
B. AIM: To demonstrate the process of osmosis with varying solution concentration
|
Material Required: Potato tubes, potato peelers, knives, ruler, petri-dshes, and sucrose solution of 0.2M, 0.4M, 0.6M and 0.8M.
Procedure:
|
|
Serial dilution table for preparation of final sucrose concentration.
| Amount of distilled water to be added | Amount of sucrose solution to be added | Final sucrose concentration | |
|---|---|---|---|
| 1 | 8ml | 2ml | 0.2M |
| 2 | 6ml | 4ml | 0.4M |
| 3 | 4ml | 6ml | 0.6M |
| 4 | 2ml | 8ml | 0.8M |
| 5 | 0ml | 10ml | 1 M |
OBSERVATION:
Table showing change in the size and mass of the potato tissue

Conclusion : ....................................................................................................................................................................................................................................................................................................................................................................................................................................................................................................................................………………...
III. STUDY OF PLASMOLYSIS.
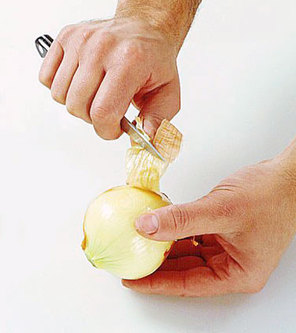
A. Aim : To demonstrate the process of plasmolysis in onion cells.
Material required:
Onion bulb, watch glass, petri-dish, slides, cover-slips, forceps, brush, needles, microscope and 20% concentrated sucrose solution.
Onion bulb, watch glass, petri-dish, slides, cover-slips, forceps, brush, needles, microscope and 20% concentrated sucrose solution.
|
Procedure :
|
|
|
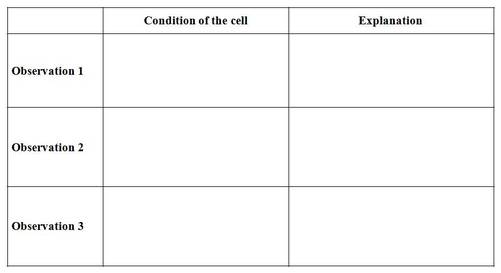
Observation table:
|
Click to set custom HTML
|
Inference:
- When the peel of onion is kept in concentrated solution (hypertonic), the protoplasm shrinks as the water starts moving out due to exosmosis.
- This phenomenon of shrinkage of protoplasm when the cells are kept in a concentrated solution is known as plasmolysis.
- Further, when the cells are kept in water (hypotonic solution) the protoplasm again regains its original shape due to movement of water into the cells by the process of endosmosis. This phenomenon is called deplasmolysis.
- Always use a brush to transfer the peel.
- The peel should be cut to a proper size and its curling must be avoided.

Plasmolysed cells under microscope (10X)
Slide prepared by: Khushbu Sagparia (ISC-2013) |
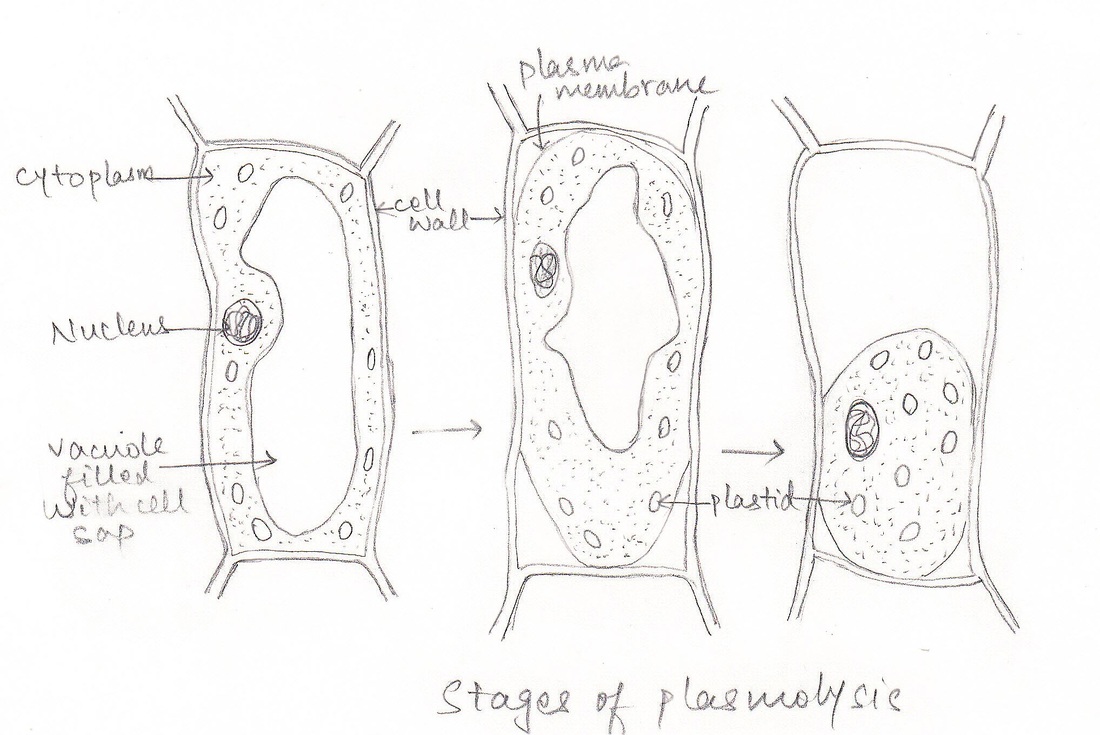
Drawing courtsey- Pooja Jasani (ISC 2014)
|
B. AIM: To determine the tonicity of solutions using Rheo discolour leaves
Material Required: Rheo discolour leaves, watch glass, petridish, slides, coverslips, forceps, brush, needle, sucrose solution (A,B,C) and microscope.
Procedure:
1. Take a Rheo discolour leaf and with the help of forceps, remove a few square pieces of the lower epidermis, each measuring 3 mm x 3 mm.
2. Take three clean, dry glass slides and label them as A, B and C.
3. Using different droppers, place samples of Liquid A on slide A, Liquid B on slide B and Liquid C on slide C.
4. Transfer a piece of lower epidermis to slide A.
5. Cover it with a cover slip.
6. Repeat the procedure for slides B and C.
7. Leave the slides for 15 minutes and observe the change under a microscope.
Record your observations in the table below:
| Solution | Number of turgid cells | Number of plasmolysed cells |
|---|---|---|
| A | ||
| B | ||
| C |
Explanation:
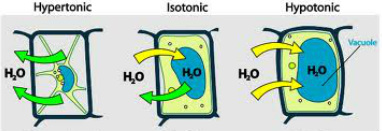
- When the peel of Rheo discolour leaf is kept in solution A (hypertonic), most of the cells were found plasmolysed suggesting that the water molecules moved out due to exosmosis.
- When the cells are kept in solution B (isotonic solution) the protoplasm regained in its original shape suggesting equilibrium of net movement of water mole
- When cells are kept in solution C (hypotonic solution) majority of the cells were found turgid as the water molecules started moving in due to endosmosis.
- Solution A is ____________________
- Solution B is ____________________
- Solution C is ____________________
IV. STUDY OF TRANSPIRATION IN LEAVES.
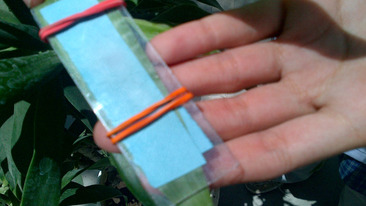
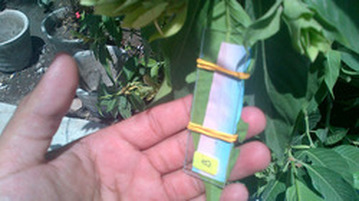
A. Aim: To demonstrate unequal transpiration from the two surfaces of a leaf.
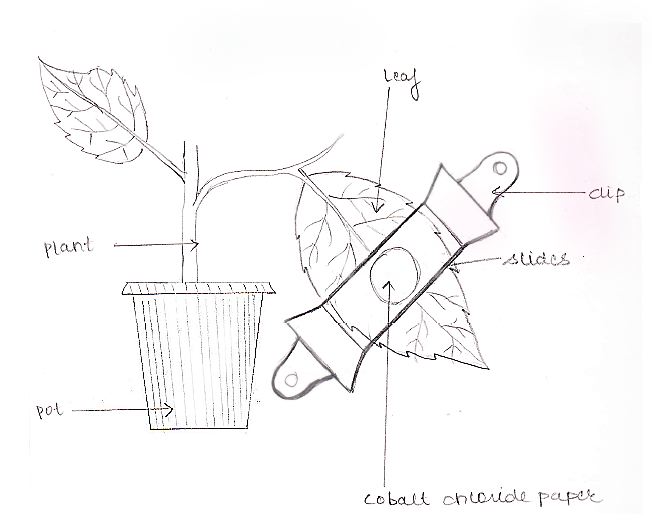
Drawing courtsey- Ayushi Kalaria (ISC 2014)
|
Material Required: A potted dicot plant with dorsi-ventral leaves well marked, CoCl2 paper, microscopic slides, rubber bands or clips, forceps, stop watch.
Procedure:
Observation:
|
Inference: :
- The upper surface of the leaf has less number of stomata whereas the lower surface has a large number of stomata. Therefore, more time is taken to change from blue to pink by the cobalt chloride paper of the upper surface.
- Since the number of stomata is more on the lower surface, less time is taken by the cobalt chloride paper to turn pink from blue on the lower surface. This also shows that transpiration is more from the lower surface i.e. unequal transpiration occurs from the two sides in leaves.
- Cobalt chloride papers should be properly dried before keeping them in the desiccators.
- The cobalt chloride paper should be fixed on both the surfaces of leaf properly.
- The cobalt chloride papers should be of the same size.
- Change in colour should be noted carefully.
- It’s better not to perform this experiment on a rainy day.
PICTURES SHOWING CHANGE IN COBALT CHLORIDE PAPER
|
|
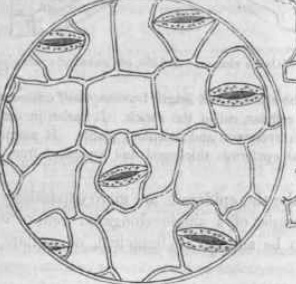
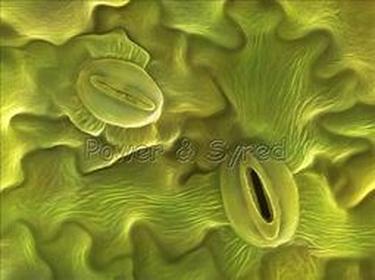
B. AIM: To study the arrangement and distribution of stomata in isobilateral and dorsi ventral leaves.
Material Required :
Isobilateral and dorsiventral leaves, forceps, Petridish, watch glass, beaker, brush, needle, safranine, glycerin etc.
Procedure :
In the dorsiventral leaf, the no. of stomata is more in the lower epidermis, and only few stomata are present in the upper epidermis. However, the isobilateral leaf has almost equal number of stomata in both the epidermis.
Precautions :
Isobilateral and dorsiventral leaves, forceps, Petridish, watch glass, beaker, brush, needle, safranine, glycerin etc.
Procedure :
- Take an isobilateral leaf, peel off a small piece of the lower epidermis and put it in water in watch glass.
- Take out the peel from the water and place it on a slide and add 2-3 drops of saffranine to stain it.
- Remove the excess stain with the help of a filter paper and put a drop of glycerine on the peel.
- Gently place a coverslip on the peel and examine under microscope(high power).
- Count the number of stomata per focus. Repeat viewing in different fields and obtain a mean value.
- Find the area of the field of the microscope by measuring the diameter with the calibrated slide or a transparent ruler.
- The required area is equal to πr2 (where r is the radius of the field of view and π=3.142).
- The number of stomata per square milimeter can then be calculated.
- Similarly, from the other side of the leaf,the stomatal count can be made.
- Repeat the process for dorsiventral leaf.
In the dorsiventral leaf, the no. of stomata is more in the lower epidermis, and only few stomata are present in the upper epidermis. However, the isobilateral leaf has almost equal number of stomata in both the epidermis.
Precautions :
- The curling of the peel should be avoided.
- Always use brush to transfer the peel from watch glass to the slide.
- Excess of glycerin should be removed by using blotting paper.
| Leaf 1(Monocot) | Leaf 2 (Dicot) | |||
|---|---|---|---|---|
| Upper surface | Lower surface | Upper surface | Lower surface | |
| No.of stomata in field 1 | ||||
| No.of stomata in field 2 | ||||
| No.of stomata in field 3 | ||||
| Average |
|
|
V. STUDY OF PHOTOSYNTHESIS
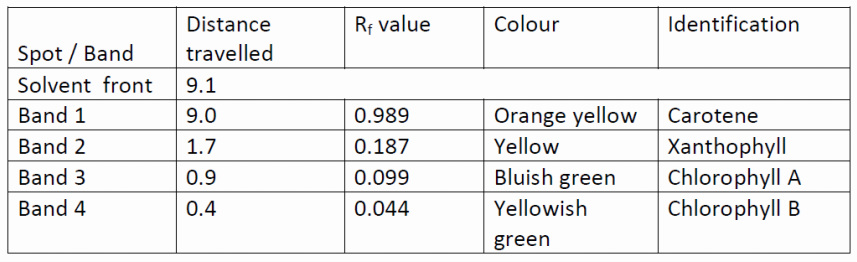
A. AIM: Separation of plant pigments (chlorophyll) by chromatography.
Material required :
Spinach leaves, coin, chromatography paper, presaturated chromatography chamber, pencil, petroleum ether and acetone
Procedure:
Rf (Relative front) = Distance moved by pigment / Distance moved by solvent
Record your result in given table.
Spinach leaves, coin, chromatography paper, presaturated chromatography chamber, pencil, petroleum ether and acetone
Procedure:
- Obtain a chromatography paper strip, take care that you are holding the paper either from the top or from sides.
- Cut the chromatography paper of required length with one pointed end.
- Leaving about 2-3 cm form pointed end draw a faint horizontal line with pencil.
- This line is your origin line or base line.
- Get chlorophyll pigment by scrapping of rolling a coin over the given leaf about 10-15 times. Keep on rolling till you get a heavy green colored line on the edge of coin.
- Transfer that pigment on the line which was drawn on the chromatography paper.
- Let it be dried, by the mean time obtain a large test tube which is saturated with solvent system (9:1 petroleum ether: acetone).
- Put your chromatography strip in to that saturated tube in such a way that no edge of paper should touch the inner side of glass tube and then close the tube.
- Solvent in the tube will start rising up, when solvent reaches 2/3 of paper length remove paper form chromatography chamber and immediately draw a line where solvent has reached. This will be your solvent front.
- Chlorophyll b yellowish green colour
- Chlorophyll a Bluish green colour
- Xanthophyll yellow colour
- Carotene orange yellow colour
Rf (Relative front) = Distance moved by pigment / Distance moved by solvent
Record your result in given table.
|
|
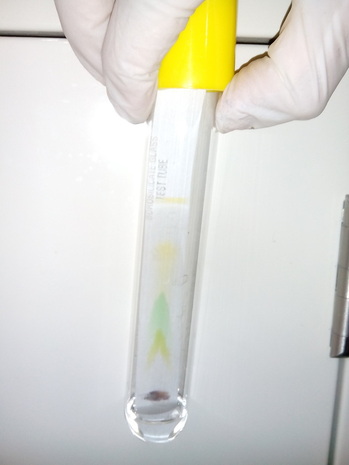
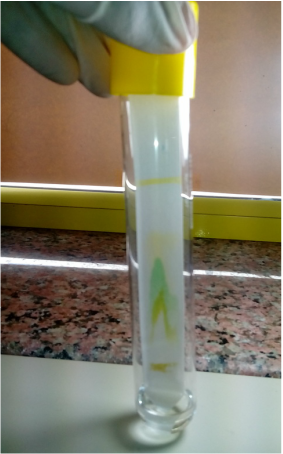
B. AIM: To demonstrate the evolution of oxygen during photosynthesis in aquatic plant.
|
MATERIAL REQUIRED: Beaker, funnel, test tubes, water, wax, few twigs of hydrilla plant, alkaline pyrogallate solution, match stick.
PROCEDURE: 1. Take a clean beaker. Fill it to two-third with tap water. 2. Take few hydrilla twigs and keep them in beaker of tap water in such a way that all the cut ends of the twigs face upwards. Keep a funnel inverted over the plants in a way that it covers all Hydrilla twigs. 3. Now take a test tube and fill it full with water and place it inverted on the funnel as shown in figure. 4 . Keep the apparatus in sunlight. OBSERVATION: After some time, it is seen that bubbles of gas are coming out of the hole of the stem of funnel and are collected in the test tube by displacing water. NOTE: you can count the number of bubbles per minute coming out of the hole of cut ends of hydrilla. When some gas is collected in test tube, add some alkaline pyrogallate solution. The gas is absorbed immediately thus indicating that it was oxygen gas or bring a burning matchstick in the gas , it starts burning more brightly. INFERENCE: This experiment shows that oxygen is evolved during photosynthesis. |
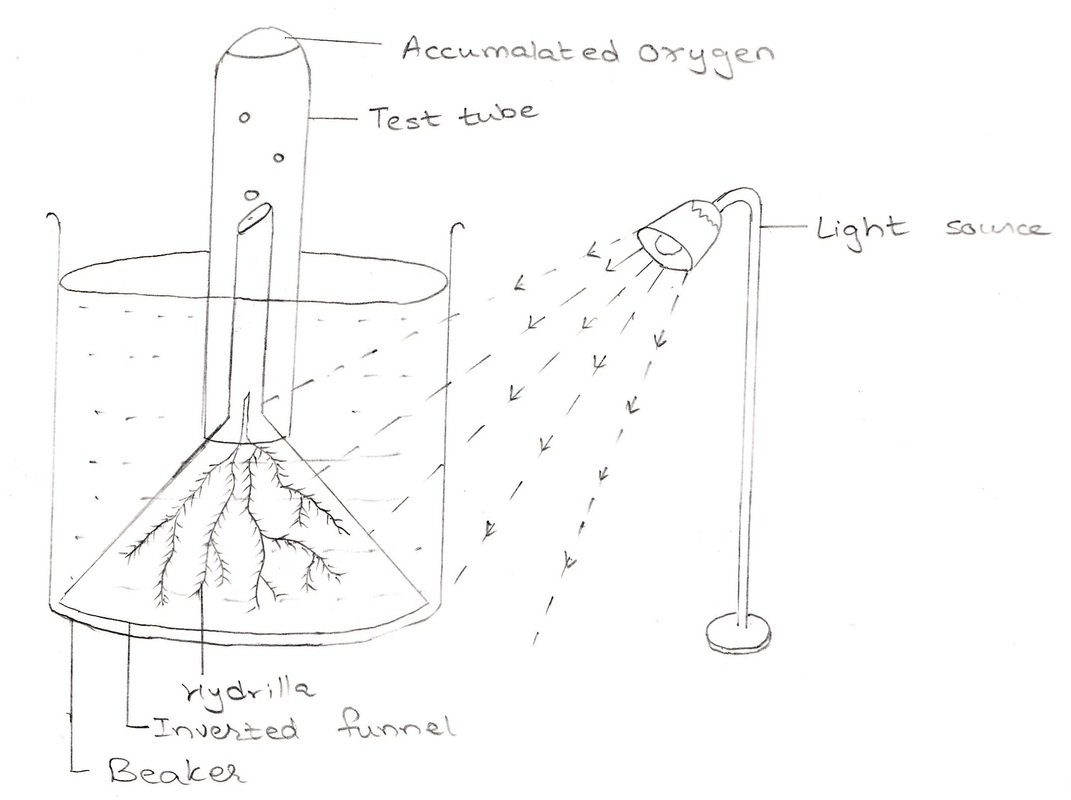
Drawing courtsey- Aalok Thakkar (ISC 2015)
Experimental setup showing evolution of oxygen during photosynthesis.
|
D. Aim: To study the effect of different concentation of CO2 on the rate of photosynthesis.
Material required:
Beaker, funnel, test tubes, sodium bicarbonate solution (0.05%,0.1%,0.15%,0.2% and 0.25%) and fresh twigs of Hydrilla,Vallisneria, Ceratophyllum, Eichhornia, Nymphaea, Elodea, Cabomba etc.
Procedure:
Take a known amount of actively photosynthesizing Hydrilla plants in a beaker containing 0.05% of sodium bicarbonate solution.
· The amount of Hydrilla plants taken must be kept constant throughout the experiment.keep a funnel inverted over the plants. Keep plants in such a way that all the cut ends of the twigs face upwords.
· Now keep a test tube full of water inverted on the funnel.
· Keep the experimental set up in light and count the number of air bubbles evolved in each minute for 10 minutes.
. Record your results in observation table
· Repeat the above procedure with 0.1%,0.15%,0.20% and 0.25% solutions of sodium bicarbonate in the beaker.
· Count the air bubbles evolved for 00.5%, 0.1%,0.15%,0.20% and 0.25% solutions. The volumes of the solutions taken should be same for all the strengths of the solutions.
· Plot a graph between numbers of O2 bubbles evolved per minute from Hydrilla plants for different concentrations of CO2.
Observation:
The rate of evolution of bubbles varies with concentration.
Result : As concentration of CO2 increases rate of photosynthesis(no. of bubbles evovled) also increases.
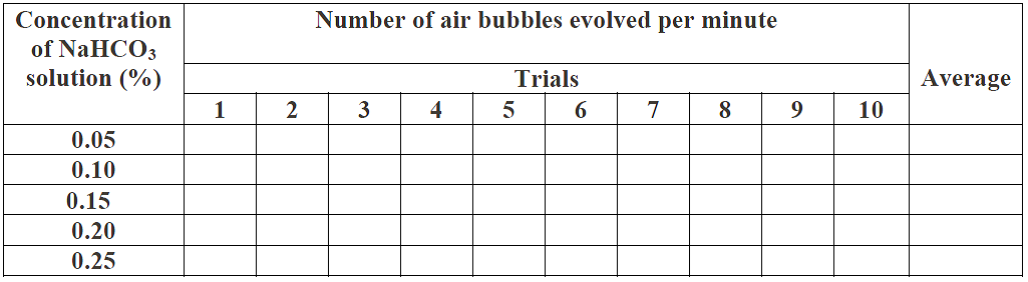
Table:The number of air bubbles evolved per minute from Hydrilla plants in different concentration of carbon dioxide.
Beaker, funnel, test tubes, sodium bicarbonate solution (0.05%,0.1%,0.15%,0.2% and 0.25%) and fresh twigs of Hydrilla,Vallisneria, Ceratophyllum, Eichhornia, Nymphaea, Elodea, Cabomba etc.
Procedure:
Take a known amount of actively photosynthesizing Hydrilla plants in a beaker containing 0.05% of sodium bicarbonate solution.
· The amount of Hydrilla plants taken must be kept constant throughout the experiment.keep a funnel inverted over the plants. Keep plants in such a way that all the cut ends of the twigs face upwords.
· Now keep a test tube full of water inverted on the funnel.
· Keep the experimental set up in light and count the number of air bubbles evolved in each minute for 10 minutes.
. Record your results in observation table
· Repeat the above procedure with 0.1%,0.15%,0.20% and 0.25% solutions of sodium bicarbonate in the beaker.
· Count the air bubbles evolved for 00.5%, 0.1%,0.15%,0.20% and 0.25% solutions. The volumes of the solutions taken should be same for all the strengths of the solutions.
· Plot a graph between numbers of O2 bubbles evolved per minute from Hydrilla plants for different concentrations of CO2.
Observation:
The rate of evolution of bubbles varies with concentration.
Result : As concentration of CO2 increases rate of photosynthesis(no. of bubbles evovled) also increases.
Table:The number of air bubbles evolved per minute from Hydrilla plants in different concentration of carbon dioxide.
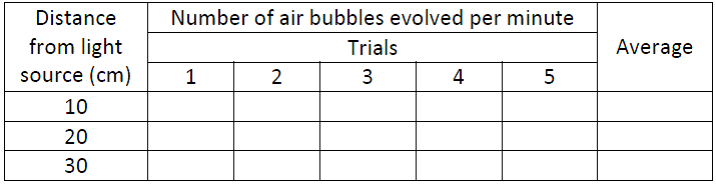
F. Aim: To study the effect of light intensity(by changing the distance) on the rate of photosynthesis using aquatic plant.
Material required: Beaker, funnel, test tubes,watch/clock, Table lamp, scale, blade, clips/rubber ring, sodium bicarbonate and fresh twigs of Hydrilla/ Vallisneria / Ceratophyllum / Eichhornia / Nymphaea etc.
Procedure:
The rate of evolution of bubbles varies with distance.
Result: The rate of photosynthesis decreases with increase in the distance from light source.
PRECAUTION :
· Twigs should be placed such that their cut ends are facing upwards in the stem of the inverted funnel.
· Fresh Hydrilla to be used.
· Hydrilla twigs should be obliquely cut.
Observation Table:
Procedure:
- Take a known amount of actively photosynthesizing Hydrilla plants in a beaker full of water.
- Keep a funnel inverted over the plants. Keep plants in such a way that cut end of the twig face upwards.
- Keep a test tube full of water inverted on the funnel.
- Keep the experimental set up in front of table lamp at the distance of 10 cm & switch on the table lamp.
- When bubbles appear, count the number of bubbles for 1 minute .
- Record your observations as shown in table given below.Count the no. of bubbles for 4 more times at same distance by giving 2 minutes resting time between each trial. Record your results in observation table.
- Now repeat this step by keeping the table lamp at the distance of 20 cm & 30 cm & count the number of bubbles produced per minute.
- Plot a graph between numbers of bubbles evolved per minute from Hydrilla plants for different distances..
The rate of evolution of bubbles varies with distance.
Result: The rate of photosynthesis decreases with increase in the distance from light source.
PRECAUTION :
· Twigs should be placed such that their cut ends are facing upwards in the stem of the inverted funnel.
· Fresh Hydrilla to be used.
· Hydrilla twigs should be obliquely cut.
Observation Table: